Sensing Biodiversity Across Scales
It is generally established that through the intensification of fertilisation and mowing practices in grasslands, the provision of ‘feed production’ as ecosystem service increases, but at the cost of biodiversity and other ecosystem functions. Remote sensing is useful to map certain plant traits and classify the vegetation into functional groups at coarse scales. However, due to the spatial discrepancies between ecological processes and management units in coupled social-ecological systems, we still have a limited understanding of the effects of land use on the relationship between biodiversity – ecosystem functions – and ecosystem services. For instance, while field ecologists measure traits at the species scale, satellites measure traits at pixel scale. Thus, pixels represent inter-pixel variance instead of inter-specific variance. Also, biodiversity and ecosystem functions can vary in space and time with a large number of drivers (e.g., succession stages, climatic gradients and variability, soil properties, land use, etc.) making extrapolations challenging.
We aim to improve the mechanistic understanding of the effects of land use on the interplay between biodiversity – ecosystem functions – and ecosystem services. For that, we are analysing the relationships between functional and structural diversity and the ecosystem service of forage production, and their temporal variation for three spatial scales (plot, farm, and landscape). We will achieve this by combining plot-based ecological and remote sensing research on land-use intensity and 5 Essential Biodiversity Variables (EBVs): Aboveground Biomass (AGB), Above Net Primary Productivity (ANPP), Leaf Area Index (LAI), plant phenology, and functional diversity.
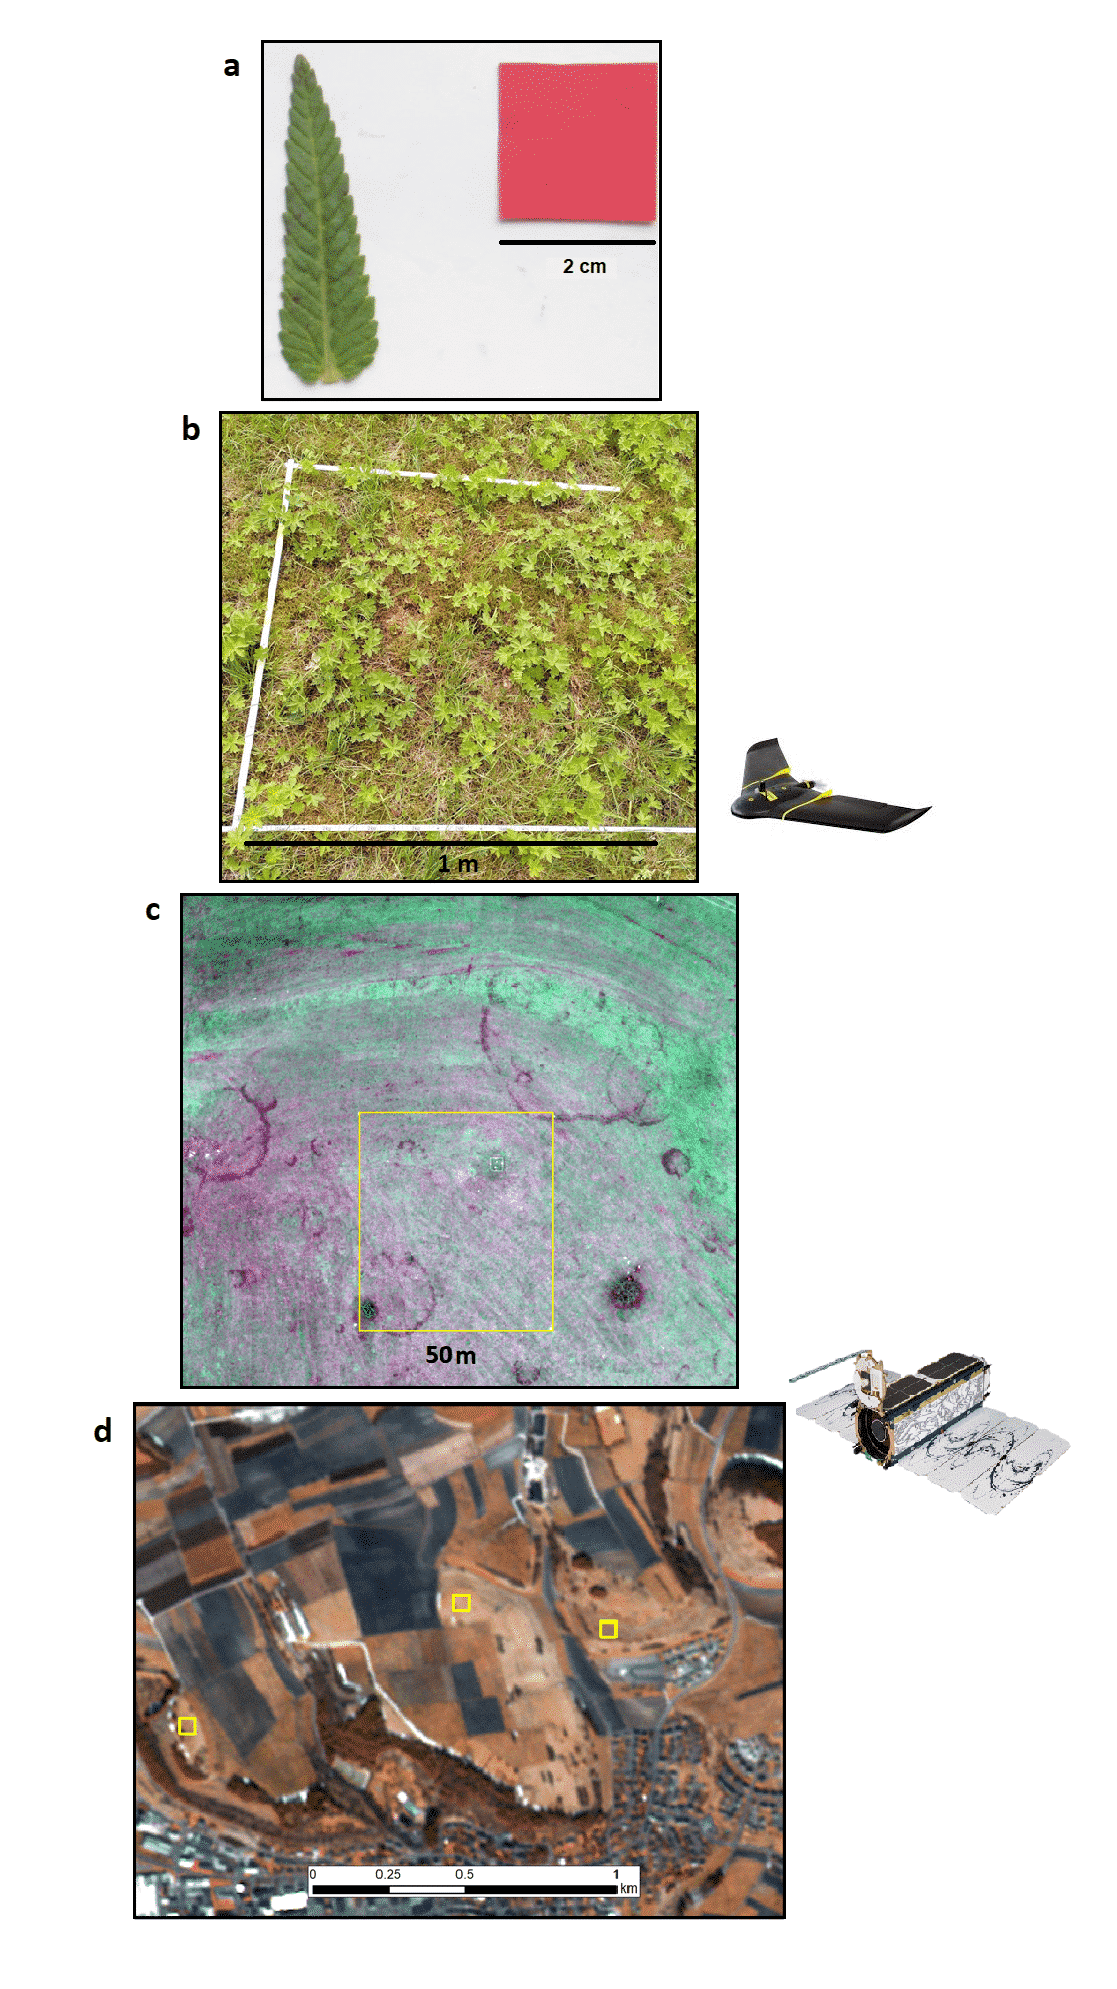
The data collected from the 5 EBVs during a full annual cycle is allowing us to quantify forage production along with functional composition and diversity across the season at sub-plot level. At the same time and in collaboration with Core-3, we are retrieving multispectral and microwave data from UAVs and multiple satellites (Sentinel-1 & 2, Landsat-8, MODIS and PlanetScope). Following a multiscale sampling and upscaling strategy we are using machine learning and artificial intelligence algorithms to scale up the field information to the satellite pixels, as well as to a landscape scale.
We hypothesise that (i) the five EBVs can be derived on multiple spatial scales using multimodal satellite image time series data; and that (ii) the effects of land use on the relationship of biodiversity to ecosystem functions and services vary across spatial scales. Here, the functional and structural diversity is likely to play a key role in the level and temporal stability of feed production.
In our project SEBAS, we have so far addressed the first hypothesis and successfully upscaled some of the five EBVs with satellite image time series. For this purpose, several deep learning models and random forest algorithms were trained and validated with vegetation data collected by the SEBAS and the Botany team. Good predictions were obtained for aboveground plant biomass and plant species richness in grasslands across the three exploratory regions (Muro et al. 2022). Predictions based on time series also allow us to study management effects over the growing season.
Furthermore, we produced good spatial models on differences in plant species composition (beta diversity). In contrast, the upscaling of community-weighted plant functional traits using Sentinel-2 satellite imagery was not successful, e.g. regarding specific leaf area, leaf dry matter content and chlorophyll content, as heterogeneity within pixels may not be captured.
Field spectroscopy as another remote sensing technique was used to predict forage quality at the plot scale and is expected to replace destructive and costly measurements in the future.
Please find further information about our results in the references under ’Publications’.
Public Datasets
Non-public datasets
Scientific assistants